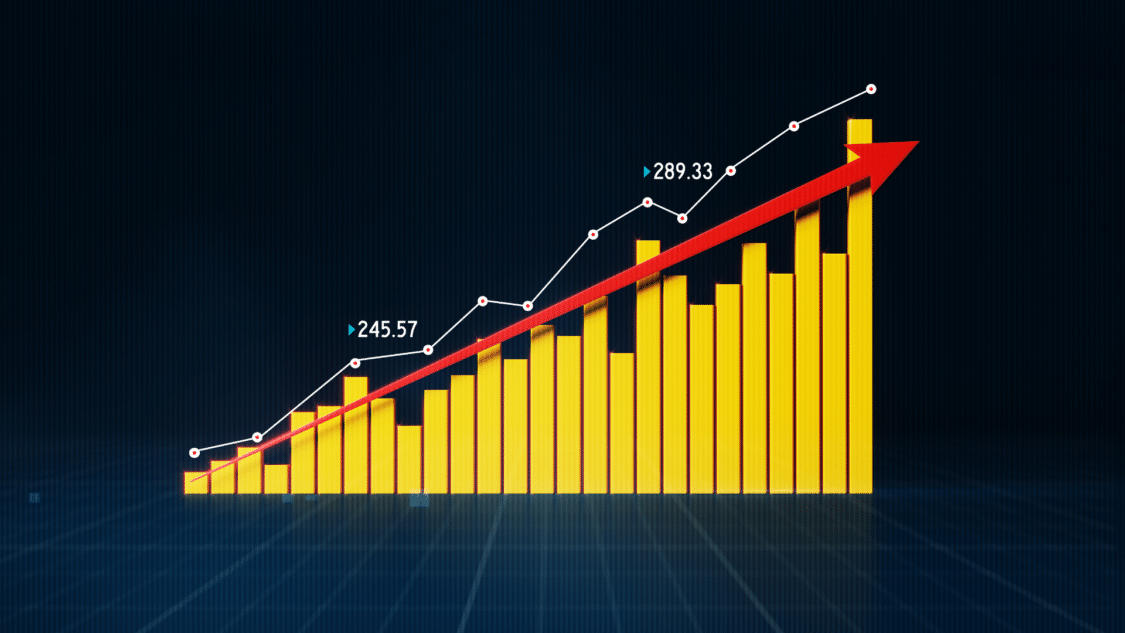
Technical Analysis, also known as charting, is a form of Analysis of the market’s behaviour. The term “charting” comes from creating charts or graphical representations of price data. It is called charting because analysts use charts as a primary tool to study and analyze price patterns and trends. By observing these charts, analysts can identify critical levels of support and resistance, detect patterns like head and shoulders or triangles, and predict potential future price movements.
The most crucial notion is that this Analysis aims to predict what the future holds for the market. It analyses the market’s behaviour and, based on its history and volume data comes up with technical Analysis. Another common approach to analysing securities and determining which investment to go forth with is Fundamental Analysis.

Technical Analysis
Technical analysis is the process of examining an asset’s current and previous price points. The assumption that goes hand in hand with technical analysis is that the market works predictably. The highs and lows are a trend and are generally not random fluctuations.
Technical analysis studies price movements, such as supply and demand, which reflect general market sentiment. In other words, an asset’s price reflects the opposing selling and purchasing forces. This comes hand in hand with the emotions of traders and investors, what we call fear and greed.
This form of analysis is usually more efficient when analyzing a market operating under normal circumstances, per see, with high volume and liquidity. Traders use indicators-based charting techniques to evaluate prices and eventually find profitable chances. Technical analysis indicators may assist traders in identifying present trends and providing insight into trends that may arise. Because TA indicators are prone to error, some traders use many indicators to reduce that risk.

What are the four basics of technical analysis?
The four basics of technical analysis are Price, Volume, Trends and Support/Resistance.
Price is the primary focus of technical analysis, represents the value at which a security is being traded and is shown on price charts. Secondly, Volume refers to the number of shares or contracts traded within a certain period. Investigating the Volume aids in identifying the level of market participation and indicates the impact and strength of price movements. Trends are the movements of prices over some time. Technical analysis aims to determine and follow trends of all forms. Whether they are upward (bullish), downward (bearish), or sideways (consolidation). The support and resistance levels represent the thresholds where past buying or selling pressure has demonstrated its supremacy, thus indicating a likelihood of a price shift or deceleration.
Identifying these levels is significant in deciding the right moments to enter or exit trade transactions.
Technical analysts aim to use their knowledge of the essential principles and scrutinize them to make well-informed decisions regarding the purchase, sale, or retention of securities. They rely on their observations of signals and patterns in price charts and indicators to guide their decision-making process.
What are the 3 rules of technical analysis?
- Trend Analysis: The first principle of technical analysis involves analyzing price trends. This research suggests that prices tend to move in directions, whether upward, downward, or sideways. Traders utilize various tools such as trendlines, moving averages, and chart patterns to identify and confirm a trend’s direction.
- Support and Resistance: The idea of support and resistance is focused on technical analysis. Support means a price level that people believe is low enough to buy stocks or things so that the price doesn’t fall anymore. Resistance is when the cost of something is shown to stop going up because many people are selling it. Traders specify these levels on price charts using previous price reactions and utilize them to make decisions regarding buying or selling.
- Indicators and Oscillators: Technical analysts use various indicators and oscillators to gain insight into market conditions and potential price reversals. These tools include mathematical calculations based on historical price and volume data. Some examples include moving averages, relative strength index (RSI), moving average convergence divergence (MACD), etc. Indicators can indicate extreme buying or selling situations, the degree of trend potency, and potential entry or exit opportunities.
What is an example of technical analysis?
An example of technical analysis is the use of moving averages. Moving averages are calculated by averaging a specific number of past price data points. Moving averages mainly identify trends and areas where support and resistance can appear.
A common strategy is combining a shorter and longer-term moving average. When the smaller average line goes up over the bigger average line, things look good for the market, and prices might increase. On the other hand, if the short-term line goes under the long-term line, it could mean that stock prices might decrease. This is called a bearish signal.
Traders also use moving averages as dynamic support and resistance levels. If the price of an asset is on a higher trend and pulls back or slightly dips below a moving average, it may provide a buying opportunity, as the moving average could serve as a support level. However, if the price seems to be on a lower trend and rallies to touch or slightly go above a moving average, it may serve as a resistance level, offering a potential selling opportunity.
Fundamental Analysis
Fundamental analysis analyzes a company’s market value by examining its financial statements. It is a technique for assessing securities that aim to calculate a stock’s intrinsic value. The analysts research everything from a company’s financial condition to the state of the industry and the overall economy. The significant factors considered are assets, liabilities, income, and expenses.
Although fundamental analysis is frequently used to assess share prices, traders can apply this to various asset classes, including bonds and forex. Long-term market trends can be predicted with the help of fundamental analysis. It is typically used for long-term investments because it helps determine the stock’s expected price.
Considering all the information and points of analysis required for fundamental indicators, it is time-consuming. The fundamental analysis gives a long-term view of the market rather than a quick overall view. Traders looking to make quick decisions should come in a different direction than fundamental analysis. Short-term decision-makers should gravitate toward technical analysis, giving them a more efficient and fast market analysis.

What are the four basics of fundamental analysis?
The four basics of fundamental analysis are Economic Factors, Company Financials, Industry Analysis, and Company Management/ Competitive Advantage.
Fundamental analysis considers the overall economic factors that can influence the value of securities, including indicators such as GDP growth, inflation rates, interest rates, employment data, and government policies. This analysis also evaluates a company’s financial health, known as performance. Identifying these levels is significant in deciding the suitable moments to enter or exit trade transactions.
Understanding the industry in which a company works is crucial in fundamental analysis. Market competition, industry trends, regulatory environment, and technological advancements are the factor used to determine the company’s position within the industry. Fundamental analysis examines the quality and competency of a company’s management team. This involves evaluating their past performance, strategic decision-making abilities, and flexibility in response to evolving market circumstances. Additionally, analyzing a company’s competitive advantage, such as unique products or services, strong brand presence, or intellectual property, is essential in evaluating its long-term prospects.
Are there risks associated with Technical Analysis?
While technical analysis is a valuable tool, it does come with certain risks. The main risk is the presence of false signals. Technical indicators, patterns, and chart formations are not foolproof, as they often provide misleading or inaccurate signals. Traders must proceed cautiously and consider other factors, such as fundamental analysis and market news, to avoid making decisions based only on technical analysis. Additionally, the subjective nature of technical analysis introduces another risk. Different analysts may interpret the same charts and patterns differently, leading to mixed conclusions and discrepancies in decision-making. Traders must consider these risks and approach technical analysis with a critical mindset, using it as part of a comprehensive strategy incorporating other analysis and risk management techniques.
Conclusion:
Remember that these indicators are not always the most accurate forms of analysis. However, if it’s done well, it will definitely improve the trader’s profitability and point of view on the market. In conclusion, technical analysis is a widely and commonly used method for predicting future price movements in the financial market. Technical analysis is one of the tools available for traders and investors to use during their decision-making process. The effectiveness of any form of analysis can differ depending on market conditions and other factors. It’s essential to approach technical analysis critically and use it alongside other analysis methods for a well-rounded approach to investing.


